Implied Probability in Betting: Formula and Examples
How to calculate implied probability from American and decimal odds, why it includes the vig, what break-even win rate a price needs, and how sharps use it.
Implied probability is the chance of winning that a betting price represents. At −150 a sportsbook is implying a 60% chance; at +200, 33.3%. To calculate it, divide 1 by the decimal odds, or for American odds use odds ÷ (odds + 100) for favourites and 100 ÷ (odds + 100) for underdogs.
Sharp bettors read every line this way. They compare a price's implied probability with their best estimate of the true probability, and judge bets by that comparison, not by whether they won. This guide covers the formulas, how the bookmaker's margin hides inside them, break-even win rates, and why results are a poor scorecard over the short run.
Need only the number? The free odds converter and implied probability calculator converts any price instantly.
How to calculate implied probability from odds
Every odds format describes the same thing: what you collect for what you risk. Converting to probability puts them on one scale.
American odds
- Negative odds (favourite): implied p = odds ÷ (odds + 100), using the number without its minus sign. −150 → 150 ÷ 250 = 60.00%
- Positive odds (underdog): implied p = 100 ÷ (odds + 100). +200 → 100 ÷ 300 = 33.33%
Decimal odds
- Implied p = 1 ÷ decimal. 1.909 → 52.38%
American to decimal (the format the formulas below use): +A → 1 + A/100; −A → 1 + 100/A.
Implied probability chart for common odds
| American | Decimal | Implied probability |
|---|---|---|
| −300 | 1.333 | 75.00% |
| −200 | 1.500 | 66.67% |
| −150 | 1.667 | 60.00% |
| −110 | 1.909 | 52.38% |
| +100 | 2.000 | 50.00% |
| +130 | 2.300 | 43.48% |
| +200 | 3.000 | 33.33% |
| +350 | 4.500 | 22.22% |
Converting a probability back to odds
From a probability to a fair price: 60% → −150, 40% → +150, 25% → +300. Probability p → decimal 1/p; if that's 2.00 or more, American = (decimal − 1) × 100, otherwise American = −100 ÷ (decimal − 1).
Odds converter
Type odds in any box and the others fill in.
This calculator needs JavaScript. Enable it to use the form below; the explanation above works without it.
Enter your numbers to see results.
Why implied probabilities add up to more than 100%
Take an NHL moneyline, Kings −250 / Ducks +210 (illustrative):
| Side | Price | Implied probability |
|---|---|---|
| Kings | −250 | 71.43% |
| Ducks | +210 | 32.26% |
| Total | 103.69% |
A real set of probabilities for one game must sum to exactly 100%. The extra 3.69% is the overround, the bookmaker's built-in margin (vig or juice). Expressed as the share of all money staked that the book expects to keep, it's a hold of 3.56% (1 − 1/1.0369). The free vig calculator measures both for any market.
So the raw implied probabilities overstate both sides. The market's actual opinion only shows once you remove the margin, which is called devigging:
- Multiplicative (proportional): divide each probability by the total. Kings 68.89% (−221), Ducks 31.11% (+221).
- Power method: find the exponent k that makes the probabilities sum to 1. Kings 69.94% (−233), Ducks 30.06% (+233).
The power method assigns more of the margin to the underdog, reflecting the well-documented favourite–longshot bias (longshots tend to be overpriced). On a near-50/50 market the methods barely differ; on lopsided ones they can differ by a full percentage point. How to devig odds covers all four methods, and the no-vig fair odds calculator runs them for you.
Devig calculator
Enter every outcome's price from one sportsbook to remove the vig four ways.
This calculator needs JavaScript. Enable it to use the form below; the explanation above works without it.
Enter your numbers to see results.
Three-way markets work the same way
Hockey regulation-time (60-minute) lines have three outcomes. Say Rangers +165 / Draw +290 / Devils +140: implied 37.74% + 25.64% + 41.67% = 105.04%. Power-devigged: Rangers 36.02% (+178), Draw 24.02% (+316), Devils 39.96% (+150). Three-way markets usually carry a bigger margin than two-way ones.
Break-even win rate: the bar every bet must clear
The implied probability of the price you take is your break-even win rate: the share of such bets you must win to break even.
| Price | Break-even win rate |
|---|---|
| −120 | 54.55% |
| −110 | 52.38% |
| +100 | 50.00% |
| +150 | 40.00% |
This is why "I hit 55% of my picks" means nothing on its own. At −120 that's barely break-even; at +100 it's a big edge. Your edge per bet is your true win probability measured against the break-even rate, which the expected value formula captures exactly:
EV = true p × decimal odds − 1
The value betting guide builds a full +EV process on that one formula, and the betting EV calculator applies it to any price.
The betting market as a probability estimate
Once you strip the vig, a betting line is a probability forecast, and from a sharp book it's a very good one. Prices at high-limit books are shaped by the money of people who model games for a living, and they keep moving until the market roughly agrees. By game time, the closing line has absorbed injuries, lineups, weather, goalie confirmations and pitching changes.
That's why sharp bettors start from the market rather than from their gut. The question is never "Who's going to win?" It is:
Is the probability implied by this price lower than the true probability of the outcome?
If a rec book offers +145 on an MLB underdog whose sharp, devigged fair price is +135, that book implies 40.82% for an outcome with a 42.55% true chance. That's the gap you bet into.
Can a winning bet be a bad bet?
Yes, and a losing bet can be a good one.
A bad bet that usually wins
You lay Lakers −180 in a game where the fair price is −150 (a 60% true chance).
- Decimal 1.5556 (1 + 100/180); EV = 0.60 × 1.5556 − 1 ≈ −6.67%
This bet wins 60% of the time. If you make it often, you'll cash plenty of tickets and still lose about $6.67 per $100 staked over the long run. Bettors who lay big favourites often feel like winners for exactly this reason.
A good bet that usually loses
You take an MLB underdog at +145 when the fair price is +135 (a 42.55% true chance).
- EV = 0.42553 × 2.45 − 1 ≈ +4.26%
This bet loses 57% of the time. If tonight's game goes the wrong way, nothing about the decision was wrong. You took a better-than-fair price on a 42.55% shot, and over hundreds of similar bets that is worth about $4.26 per $100.
Results versus process
How noisy are results over a few hundred bets? Compare two bettors who both bet at −110:
- The process bettor finds +3% EV spots: a true win rate of 53.95% against a 52.38% break-even.
- The coin-flip picker has no edge: a 50% win rate at −110, an EV of −4.55%.
The chart shows the exact chance each one is in profit after a given number of bets:
After 100 bets, the coin-flip picker is still ahead about 31% of the time, and the +3% bettor is behind almost 39% of the time. Only after about 1,000 bets does the gap become stark: the +3% bettor is ahead about 84.5% of the time, the coin-flipper about 7%.
So a hot month proves little, and neither does a cold one. What you can control is the process: bet only at prices above fair, and size bets sensibly. The Kelly criterion and bankroll management: flat vs Kelly cover the sizing half.
Calibration: are your probabilities honest?
If you build your own numbers, model or gut, the test is calibration: do outcomes you call 55% happen about 55% of the time?
Suppose you've made 200 bets you rated at 55%. You'd expect 110 wins, but the standard deviation is √(200 × 0.55 × 0.45) ≈ 7.0 wins, so anything from roughly 96 to 124 wins (48%–62%) is consistent with being perfectly calibrated. With 1,000 such bets the range narrows to about 519–581 wins (52%–58%). Calibration takes large samples to check, which is one more reason to lean on the sharp market's probabilities rather than your own until you have years of data.
Closing line value: the process metric that works fast
Because results are so noisy, sharp bettors grade themselves with closing line value (CLV): the EV of the price you took, measured against the devigged sharp price at the close.
Example: you bet the Rangers at +178 on Monday. By puck drop the sharp three-way market has the Rangers at a fair 37.5%. Your CLV = 0.375 × 2.78 − 1 = +4.25%. The game result doesn't change that number.
Why it works: the closing line is the market's most informed probability estimate, so if you consistently take better prices than it, your bets are very likely +EV. Hundreds of bets of positive CLV is far stronger evidence of skill than a winning record over the same sample. The caveats: CLV assumes the closing market is efficient (less true for thin props), and it should be measured against a sharp, devigged close, not a rec book's.
Implied probability for spreads, totals, props and parlays
The same conversion works for every market type, as long as you compare like with like.
- Spreads and totals. "Bills −3 (−110)" implies 52.38% for the Bills covering that exact line (a push at exactly 3 refunds the stake). That's not the probability they win, and it isn't the probability they cover −2.5. Half a point around key numbers (3 and 7 in the NFL) can be worth several percentage points, so never compare prices on different lines.
- Player props. "Over 24.5 points (+105)" implies 48.78% for that exact line. Props usually carry more vig than main markets, and some books quote only one side, which makes a fair price impossible to derive from that book alone.
- Parlays. Implied probabilities multiply. Two −110 legs imply 52.38% × 52.38% = 27.4%, and the vig compounds with them. Parlay EV shows when combining legs adds value and when it only stacks margin.
- Boosts and promos. A boosted price is a new implied probability to compare with the fair one. See profit boost strategy.
- Arbitrage. When the best prices on every outcome, taken from different books, imply less than 100% in total, you have an arbitrage bet.
Common implied probability mistakes
- Reading the price as the true chance. −150 means the book is implying 60% plus margin, not that the team wins 60% of the time.
- Comparing win rates across different prices. A 58% hit rate on −150 favourites loses money; 45% on +150 underdogs wins.
- Ignoring the margin. Two sides at −110 aren't "50% each". They're 52.38% each until you devig.
- Trusting small samples. Fifty bets can't distinguish a 52% bettor from a 56% one.
How OddScouter shows probabilities
OddScouter works in implied probabilities so you don't have to:
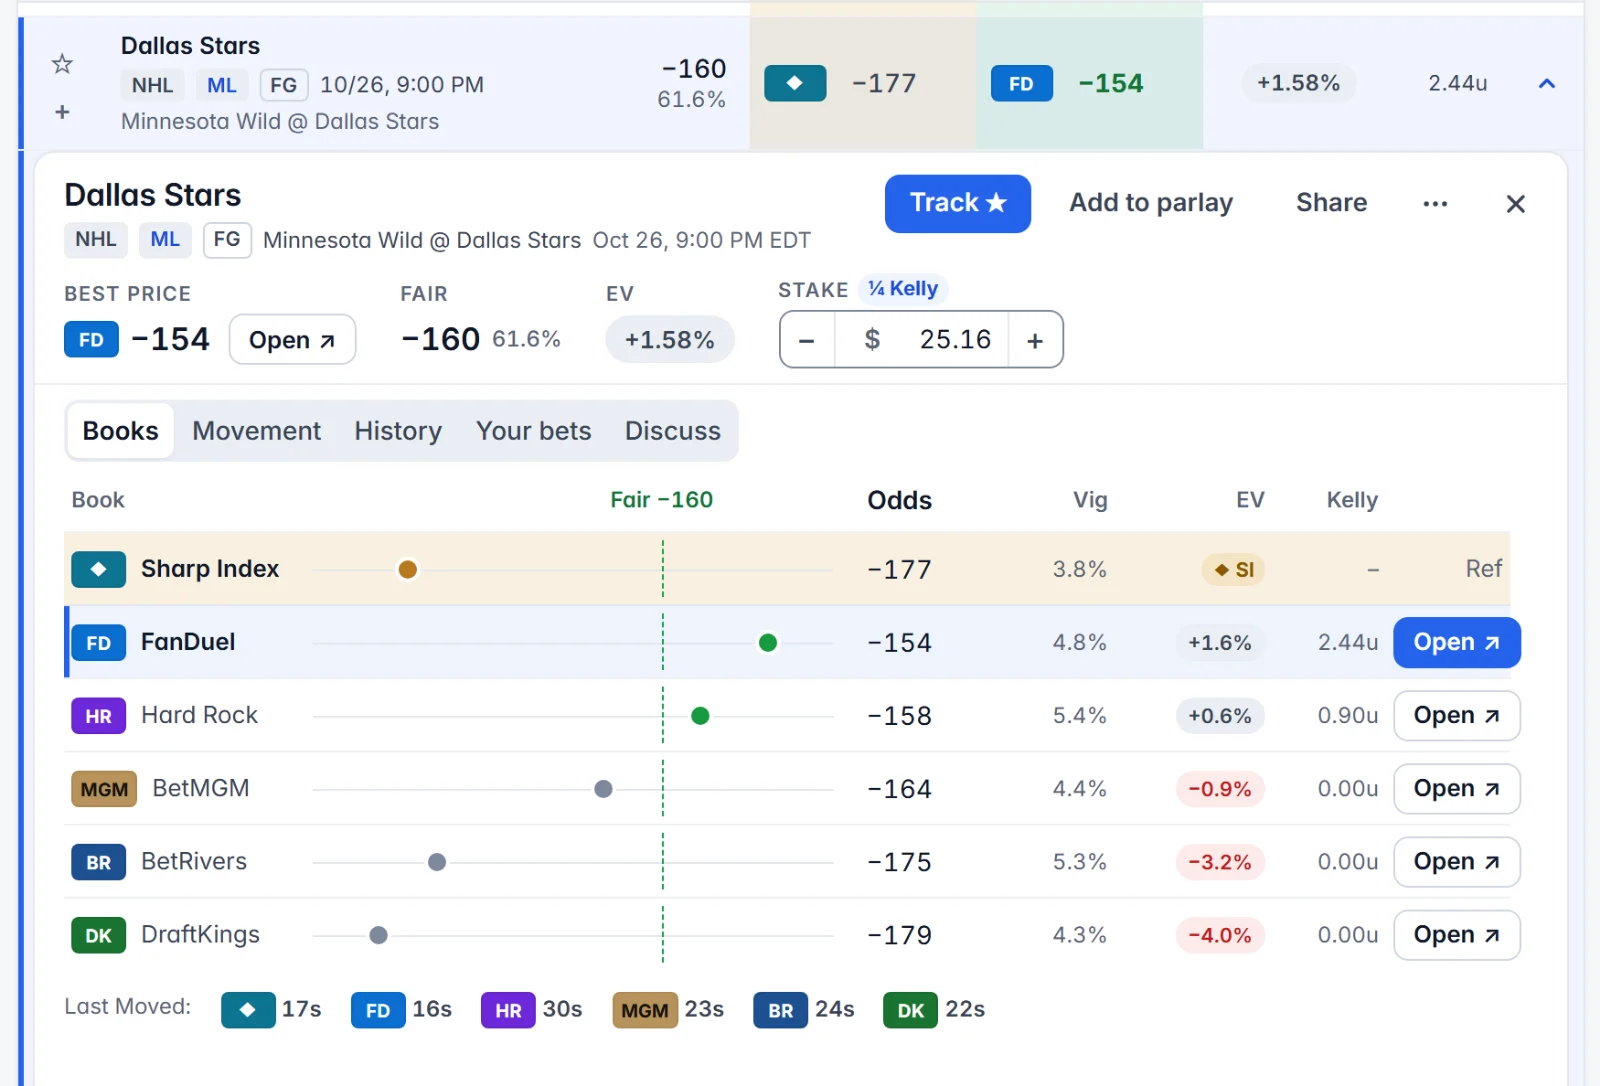
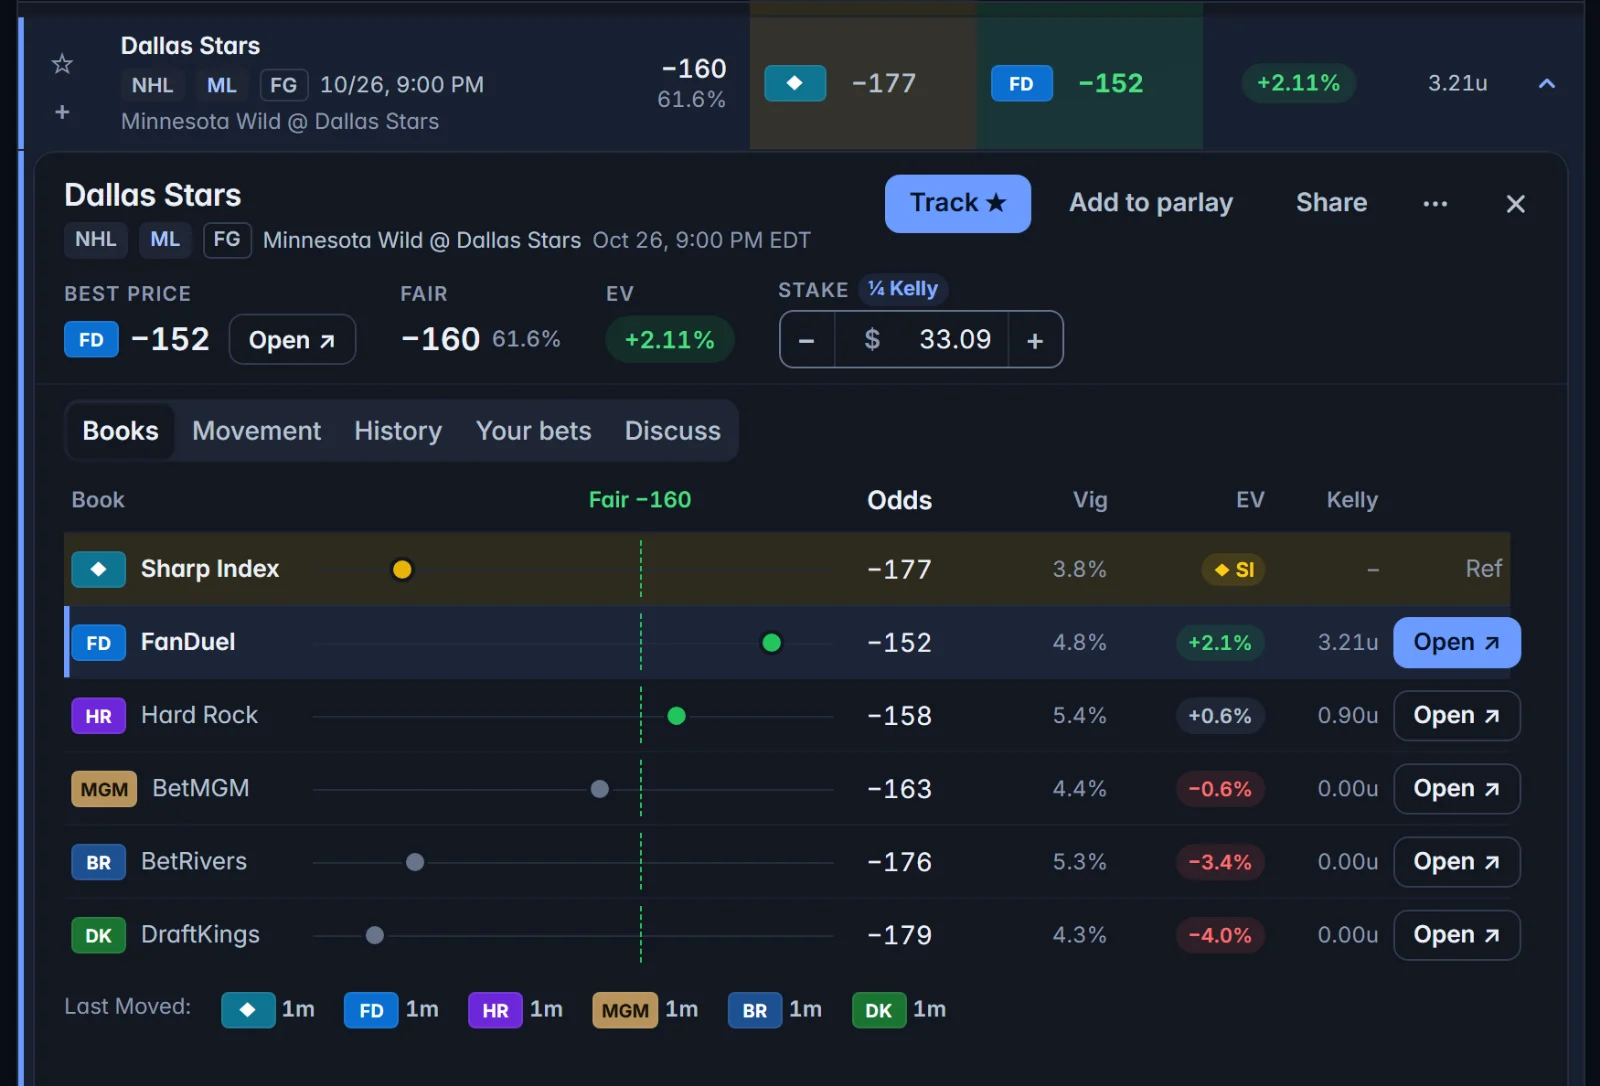
- Every book's price on the board is compared with the sharp fair line: the Sharp Index for game lines, the Sharp Index or FanDuel for props, devigged with the power method. The EV badge is the gap between that fair probability and the price.
- Expanding a bet shows each book's own vig and EV, plus how the price and fair line moved over time.
- The price calculator (in the Parlay builder tab) takes any American price and your fair chance and returns EV, fair odds, the book's implied probability, and Kelly stakes.
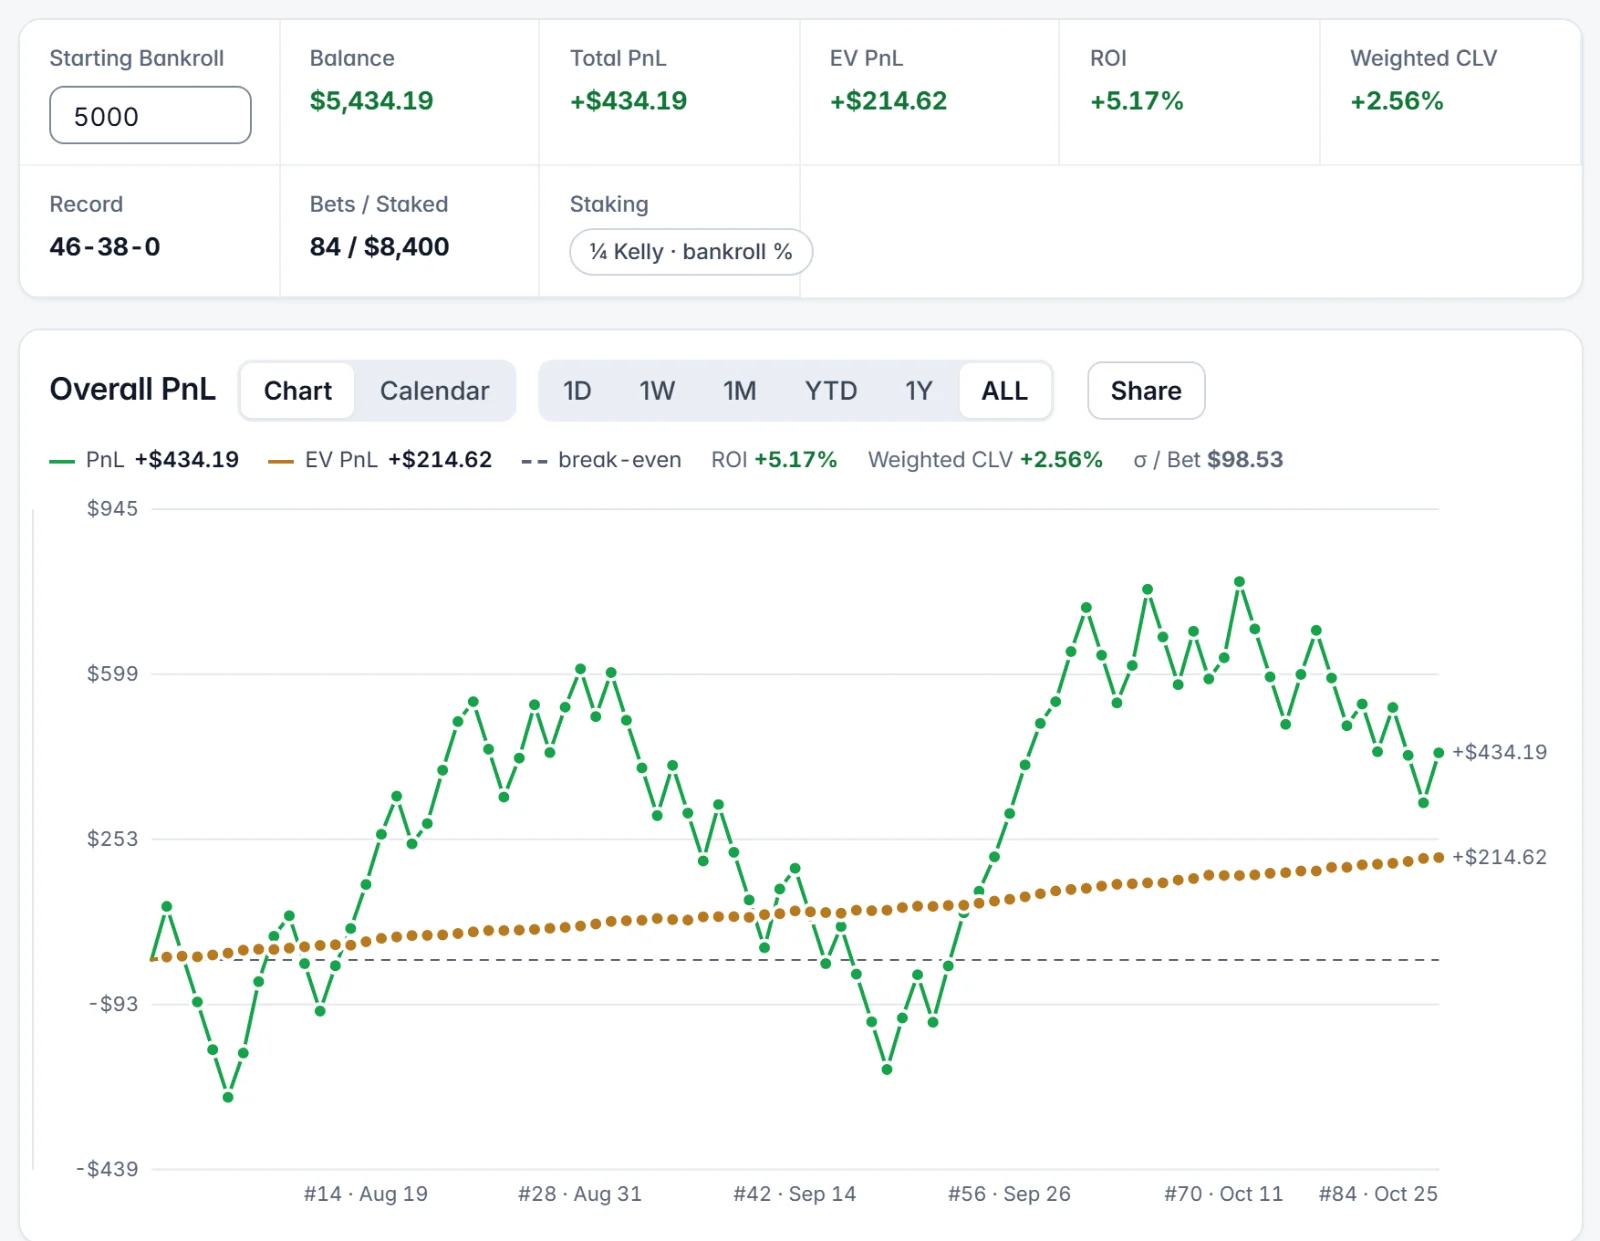
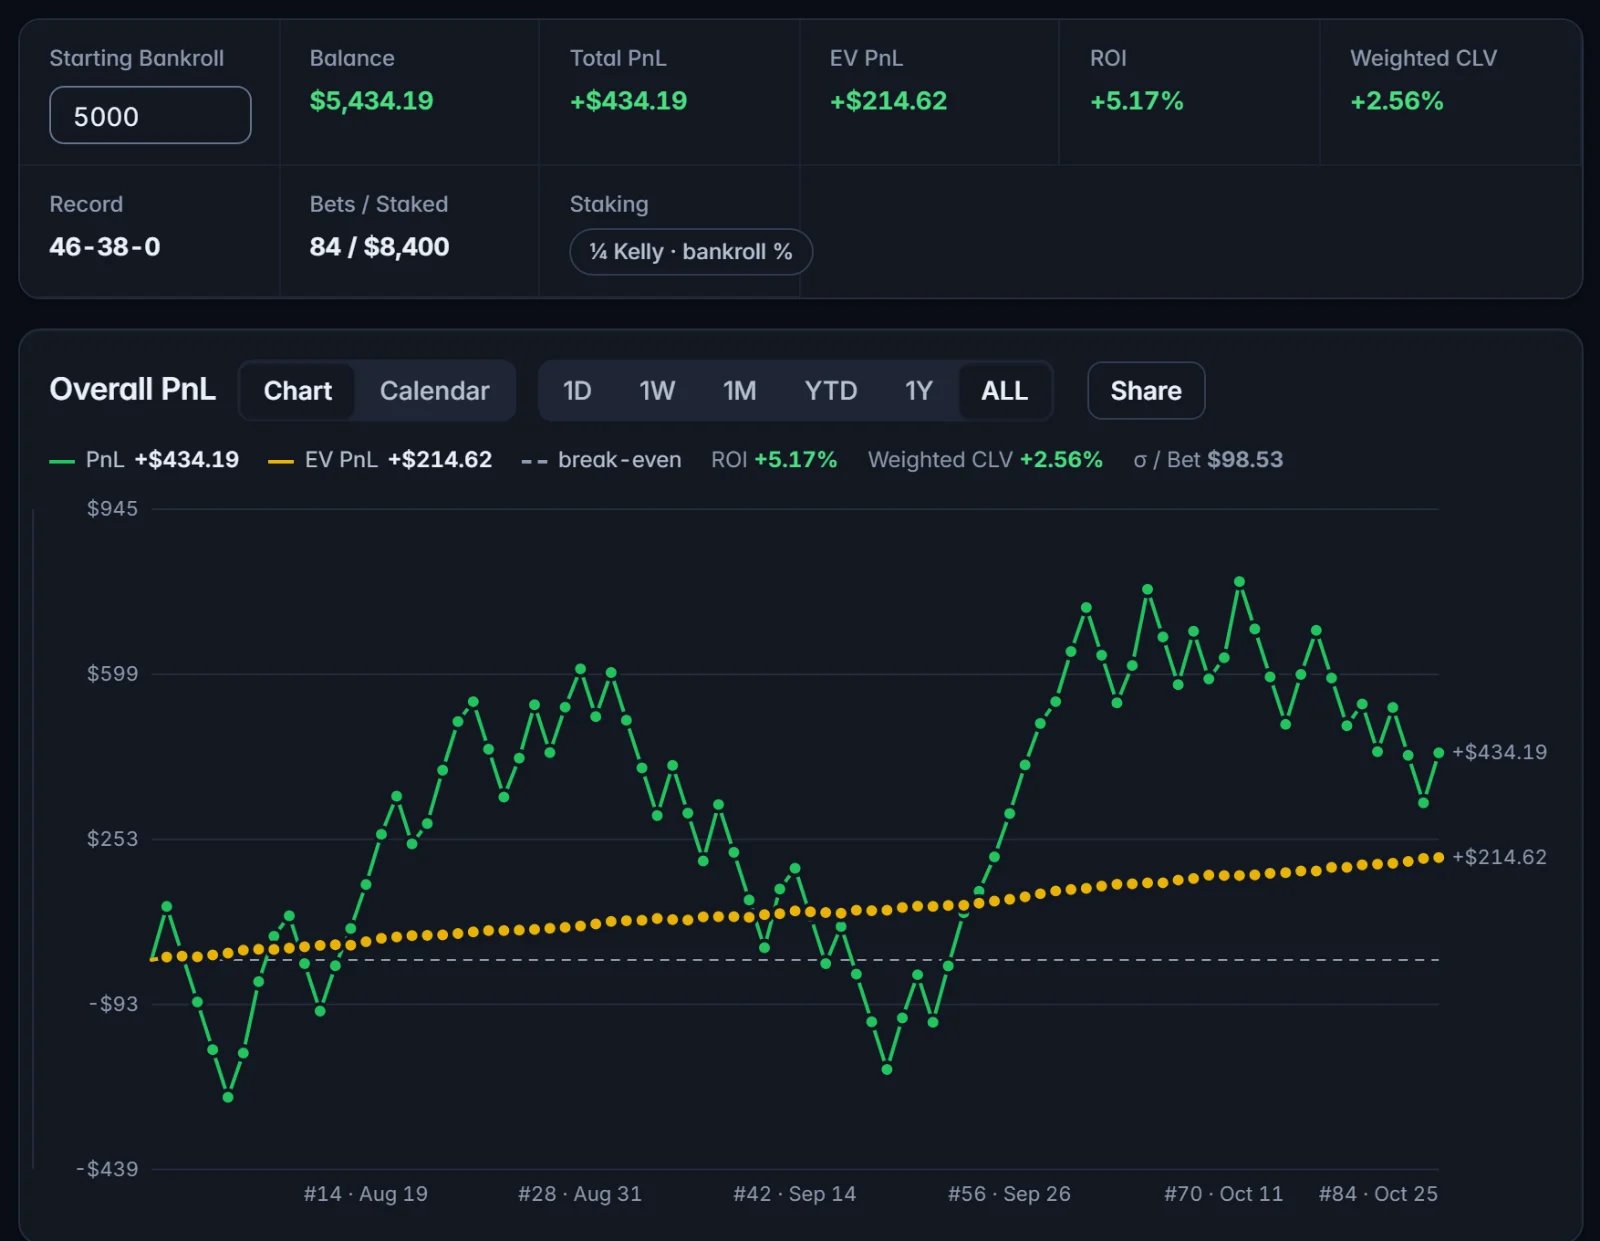
- The P&L tab grades every tracked bet against the closing fair line and reports your stake-weighted average CLV and an EV-based profit line alongside actual results.
Key takeaways
- A price is a probability: −150 = 60%, +200 = 33.3%.
- Implied probabilities include the vig; devig a sharp market for fair probabilities.
- The implied probability of your price is your break-even win rate. Your edge is your true probability measured against it.
- A bet's quality is fixed when you place it. Judge yourself by price and CLV, not by short-run results.
Related guides and calculators
- Value betting: how to find +EV bets puts implied probability to work.
- How to devig odds explains how fair probabilities are calculated.
- Parlay EV shows how probabilities and margins multiply across legs.
- The Kelly criterion turns an edge into a stake size.
- Free tools: odds converter, no-vig fair odds calculator, betting EV calculator, vig calculator.
Responsible gambling
Understanding probability helps you make better decisions, but it doesn't make any bet safe: every wager can lose, and variance can be brutal even for skilled bettors. Bet only what you can afford to lose and set limits in advance. You must be 21+ (or the legal age where you live) to bet. If gambling is causing problems for you or someone you know, call or text 1-800-GAMBLER for free, confidential support.
Examples are illustrative, not live prices or betting advice. The numbers can be reproduced with scripts/article_math.py.
Frequently asked questions
What is implied probability in betting?
Implied probability is the win chance a price represents. For American odds of −150 it is 150 ÷ 250 = 60%; for +200 it is 100 ÷ 300 = 33.3%. It includes the bookmaker's margin, so both sides of a market add up to more than 100%.
How do you calculate implied probability from American odds?
For negative odds, divide the odds by the odds plus 100: −110 → 110 ÷ 210 = 52.38%. For positive odds, divide 100 by the odds plus 100: +130 → 100 ÷ 230 = 43.48%. Or convert to decimal odds and take 1 ÷ decimal.
Why do implied probabilities add up to more than 100%?
The excess is the sportsbook's margin, called the vig or overround. A Kings −250 / Ducks +210 market implies 71.43% + 32.26% = 103.69%, an overround of 3.69%. Removing it (devigging) gives the fair probabilities.
What win rate do I need to break even at −110?
You need to win 52.38% of bets at −110, because that's the price's implied probability. At +150 you need 40%. Your edge is how far your true win probability sits above the break-even rate of the price you take.
Is implied probability the same as the real chance of winning?
No. Implied probability is the book's price expressed as a percentage, margin included. The real chance is unknown; the best public estimate is usually a sharp book's line with the vig removed, which is lower than the raw implied probability on every side.
Can a winning bet be a bad bet?
Yes. Laying −180 on a team whose fair price is −150 wins 60% of the time but has an expected value of −6.67%: you lose money over many such bets even though most of them cash. Bet quality is decided by price versus probability, not by the result.
Free calculators for this topic: Odds Converter and Implied Probability Calculator, Betting EV Calculator: Expected Value of Any Bet, No-Vig Calculator: Fair Odds by the Power Method, Vig Calculator: Juice, Hold and Overround of Any Bet.
OddScouter is an information tool, not a sportsbook, and nothing here is betting or financial advice. Positive expected value is not a promise of profit. You must be 21 or older. Gambling problem? Call 1-800-GAMBLER. Responsible gambling resources.